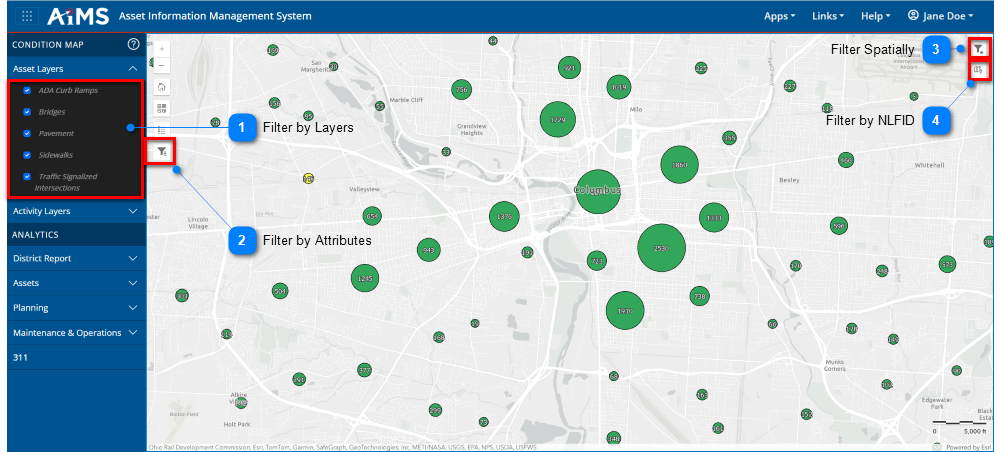
The Condition Map contains tools that support tabular and spatial filters. These filters are applied to data displayed in the map and in Analytics Dashboards (excluding 311).
Use any of the items shown below to filter data for display and analysis. The table beneath the illustration explains the numbered callouts.
Filter data by attributes, operators, and values. This involves clicking to open another dialog and entering various values for filter criteria. These filters apply to any report you later generate.
Create a spatial filter of a particular shape that includes features in the current map's extent. This involves clicking the icon to expand and view a toolbar with these icons: Draw a Polygon, Draw a Rectangle, Draw a Circle, Filter by Map Extent, Clear Spatial Features, Zoom to Selection. These filters apply to any report you later generate.These filters apply to any report you later generate.