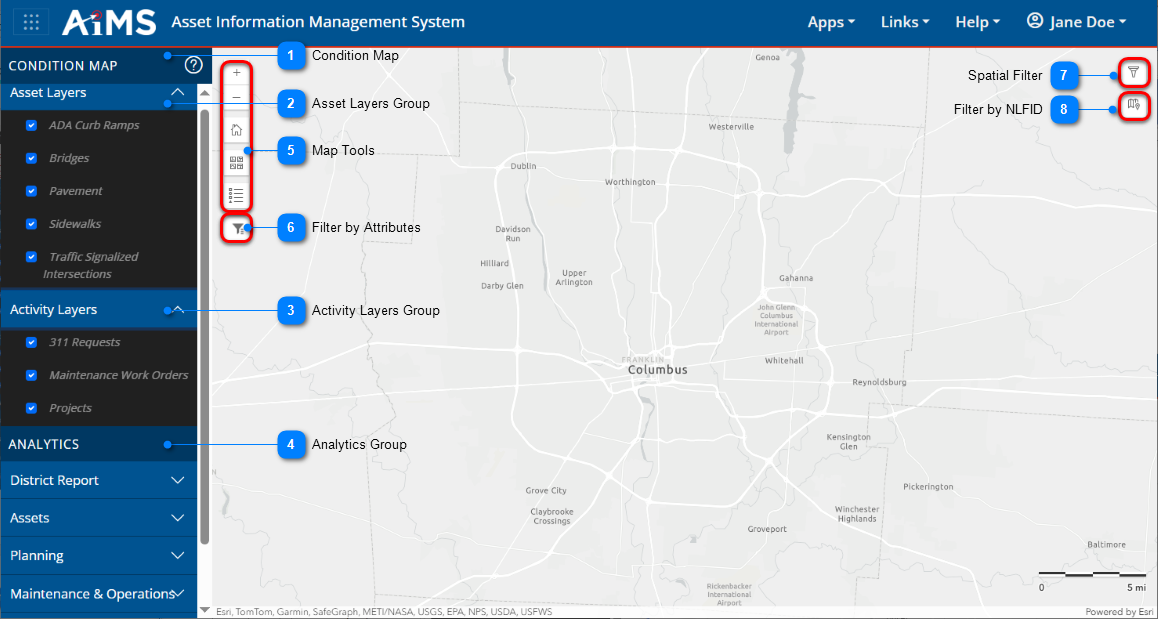
The Explore Analytics Module of the AIMS Application contains maps and dashboards with valuable data insights. Filters can be applied in the condition map, and are applied throughout the analytics module in various Power BI dashboards (reports).
1.From the AIMS Home page, click the Explore Analytics icon to open the Explore Analytics Module.
2.The Condition Map appears by default. The table beneath the illustration explains the numbered callouts. NOTE: If the blue sections on the left-hand navigation bar are not expanded as shown in the illustration, click the arrows to expand them.
Condition Map
Click this item to return to the Condition Map in case you no longer see it.
Asset Layers Group
The left-hand pane contains a group of Asset layers you can turn on and off. Click the down-arrow to see the list of asset layers. NOTE: The down-arrow becomes an up-arrow when the group is fully expanded.
•A checkmark indicates the layer is turned on; no checkmark indicates it is turned off.
•Visible layers appear in white text and non-visible layers appear in gray text. If your desired layer appears in gray text (ex: Pavement, Sidewalks), that means you must zoom in more to view it on the map.
Activity Layers Group
The left-hand pane contains a group of Activity layers you can turn on and off. Click the down-arrow to see the list of activity layers. NOTE: The down-arrow becomes an up-arrow when the group is fully expanded.
•A checkmark indicates the layer is turned on; no checkmark indicates it is turned off.
•Visible layers appear in white text and non-visible layers appear in gray text. If your desired layer appears in gray text (ex: Pavement, Sidewalks), that means you must zoom in more to view it on the map.
Analytics Group
The left-hand pane contains a group of Reports. Click the down arrow to see the list of reports. For details about reports, see: Analytic Reports.
Map Tools
Click these tools to zoom in and out and display different layers. For details, see: Navigate the Condition Map.
•The default extent of the condition map shows the entire city of Columbus, but none of the asset layers are visible at this extent. To view data in the map, zoom in until the desired layers are visible.
Filter by Attributes
Click this icon to filter map data by attribute. For details, see: Filter by Attributes.
Spatial Filter
Click this icon to filter the map spatially. For details, see: Filter Spatially.
Filter by NLFID
Click this icon to filter the map by a selected NLFID. For details, see: Filter by NLFID.


.png)