|
The map at the top center of the 311 Requests Dashboard allows spatial analysis of 311 request data. This analysis is possible using these tools:
•Binning
•Individual Points
•Map Extent Filtering
•Map Navigation
A. Binning
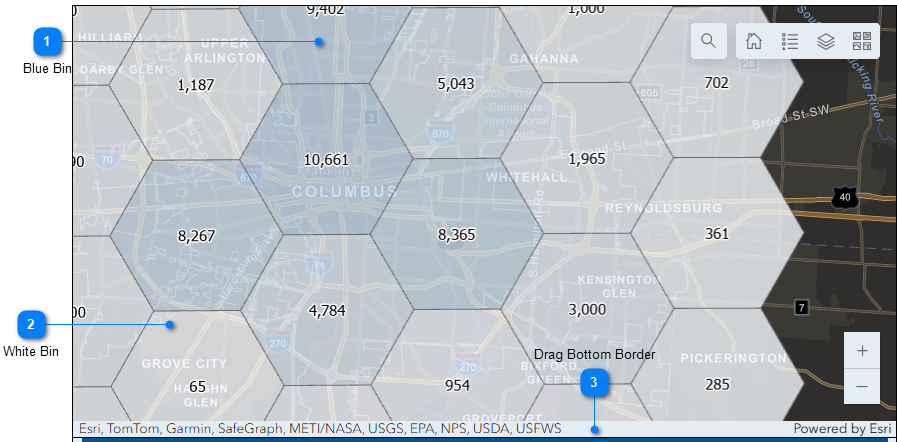
The data is displayed in hexagon shaped "bins" that group requests together. These bins display how many requests are contained within them. The colors indicate how many requests are in each bin -- the darker colored bins have more requests than the lighter colored bins.
This table beneath the illustration explains the numbered callouts in the Map View.
|

|
Blue Bin
|
|
The light blue bins contain larger numbers of assets (311 requests) than the white bins. NOTE: The darker the blue, the greater the number of assets.
|
|

|
White Bin
|
|
the white bins contains fewer numbers of assets (311 requests) than the blue bins.
|
|

|
Drag Bottom Border
|
|
Hover over the horizontal border at the bottom of the map until you see a double-arrow cursor, and then drag the cursor downward to increase the vertical space for the map.
|
B. Individual Points
1.Zoom in further to see 311 data as individual points.
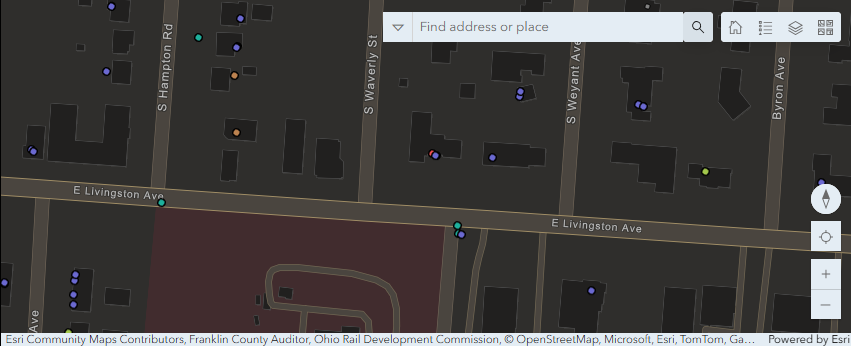
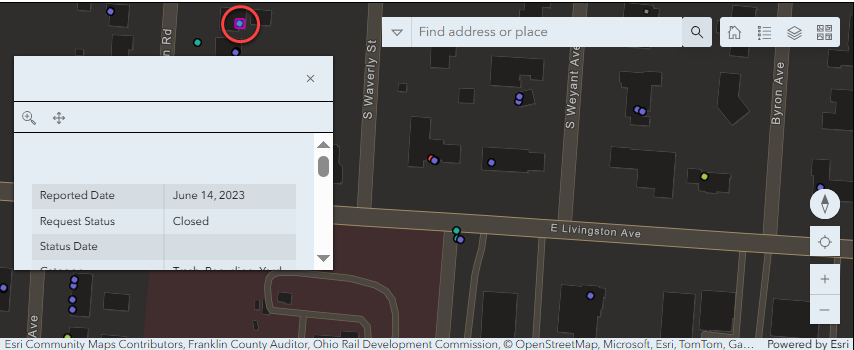
2.Click any of these points to view pop-up information in the map. NOTE: If there are multiple Reported Dates, the pop-up has right-arrow and left-arrow at the top to let you move through them (none are shown in the illustration).
C. Map Extent Filtering
If you previously filtered by Map Extent, the Map Extent filters the street name information in the left sidebar, the Map Data table in the middle, and the visible request count on the right sidebar.
The table beneath the illustration explains the numbered callouts.
.png)
|
-number-1.png)
|
Street Name Filter
|
|
The only street name option for this extent is E 5TH AVE.
|
|
-number-2.png)
|
Map Data Table
|
|
Only the 3 requests shown in the map are displayed in the table.
|
|
-number-3.png)
|
Visible Requests Count
|
|
Only 2 visible requests are noted under request counts.
|
D. Map Navigation
You can use a variety of familiar tools to navigate the map on the 311 Requests Dashboard. The table beneath the illustration explains the numbered callouts for map navigation..png)
|
.png)
|
Search
|
|
Type in an address or place. Next, select your desired result from the drop-down list or press Enter.
|
|
.png)
|
Home Extent
|
|
Click the Home Extent button to return to the default map extent showing the entire city of Columbus.
|
|
.png)
|
Legend
|
|
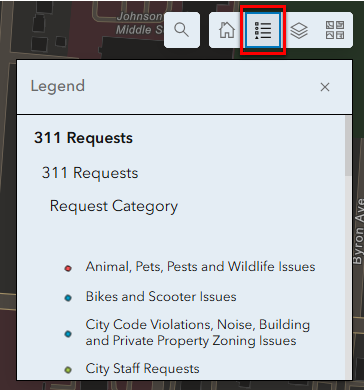
Click Legend to display an interactive legend explaining the symbology for visible layers in the map.
|
|

|
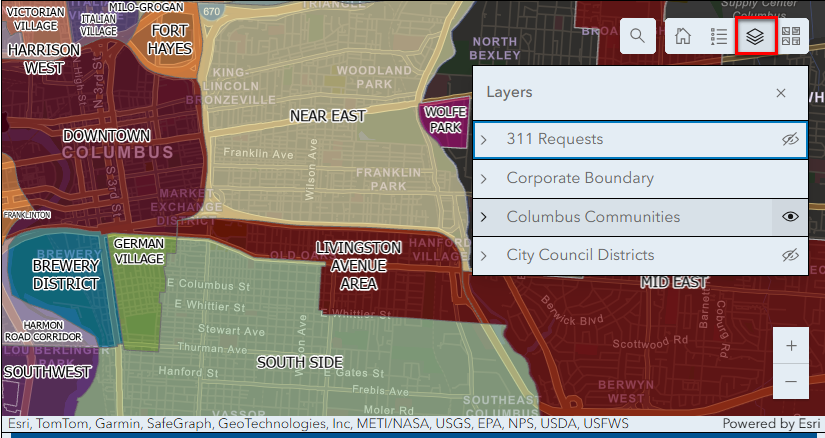
Layers
|
|
Click Layers to turn layers on and off in the map. In this illustration, the 311 Requests layer is NOT visible and the Columbus Communities layer IS visible.
|
|

|
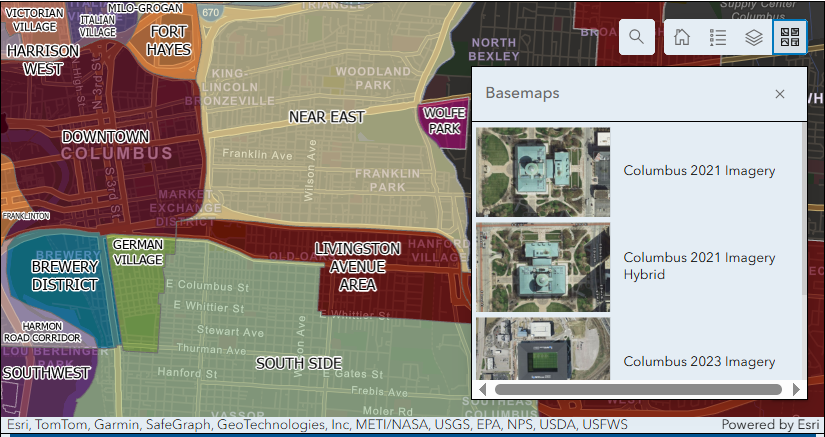
Basemap Selector
|
|
Click Basemaps to use other basemaps, such as imagery.
|
|

|
Zoom In and Out
|
|
•Click the + or - buttons at the bottom of the Map View to zoom in or out of the map.
•You may also zoom by rotating the scroll wheel of your mouse or by pinching and spreading your fingers on a touch pad.
|
|

