AIMS Help
AIMS Help


Navigation: Explore Analytics >

Analytic Reports


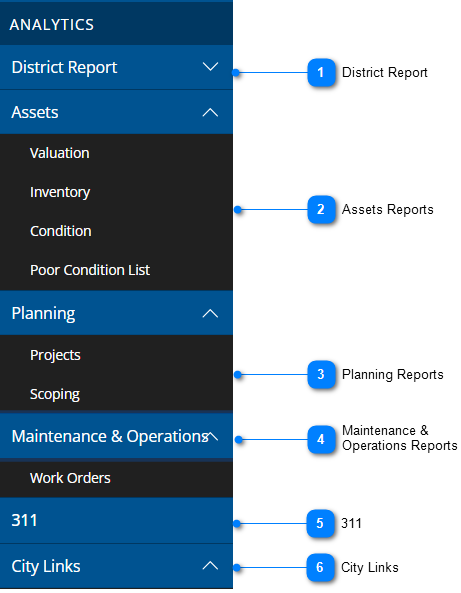
The analytic reports section in the left-hand pane contains the Public Service City Snapshot (under District Report), along with Asset reports, Planning reports, Maintenance & Operations reports, and the 311 dashboard. These reports interact with the condition map. Filters created in the condition map will be applied in the reports.


This table beneath the illustration explains the numbered callouts in the Analytics pane.

District Report

The district report drop-down list contains each page of the Department of Public Service City Snapshot.

Assets Reports

These PowerBI reports offer visualizations of asset data. These reports interact with filters created in the condition map.

Planning Reports

These PowerBI reports offer visualizations of planning data. These reports interact with filters created in the condition map.

Maintenance & Operations Reports

These PowerBI offer visualizations of Maintenance & Operations data. These reports interact with filters created in the condition map.

311

The ArcGIS Dashboard provides a map-focused view of 311 request data.

City Links

Expands to list links to different city home pages.


Copyright © 2026 Cultivate Geospatial