|
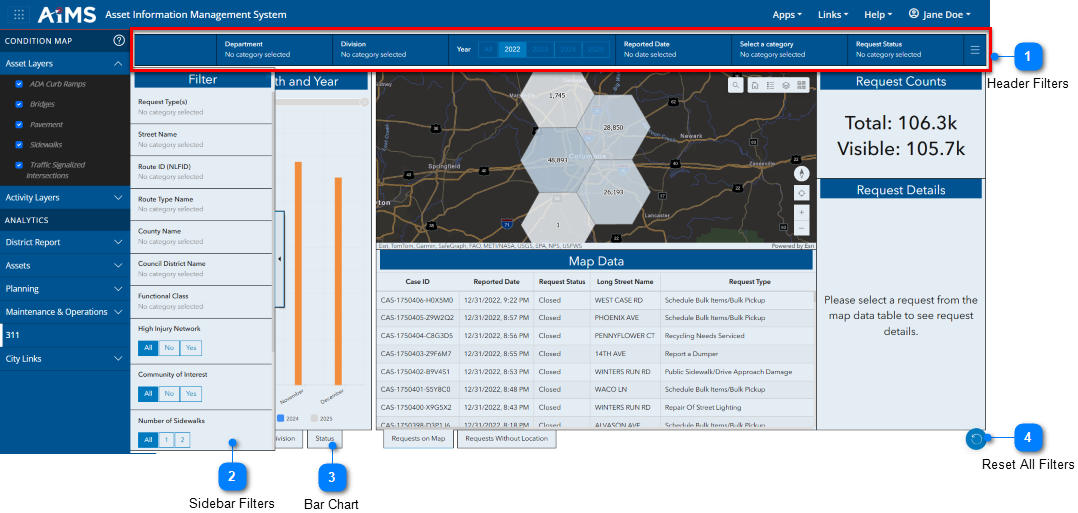
The Dashboard can be filtered by selections made in the header filters, sidebar filters, and bar charts.
The table beneath the illustration explains the numbered callouts related to filters.
|

|
Header Filters
|
|
Filter all data displayed on the Dashboard (bar charts, map data, request counts, and request details) by selecting filters for year, reported date, category, and status. For details, see: Header Filters below this table.
|
|

|
Sidebar Filters
|
|
Filter all data displayed on the Dashboard (bar charts, map data, request counts, and request details) using the sidebar filters. For details, see: Sidebar Filters
|
|

|
Bar Chart
|
|
Filter all data displayed on the Dashboard by selecting any bar on a chart. NOTE: Click the right-arrow at the bottom right of a bar chart to move between bar charts
|
|

|
Reset All Filters
|
|
Click the Refresh icon to reset all filters and return the map to the default extent showing all of Columbus. NOTE: If you cannot see the Refresh icon, maximize your screen.
|
A. Header Filters
1.Here is what the header filters look like when no filters are chosen.

These are the six attribute filters for narrowing down the data displayed on the Dashboard:
•Department
•Division
•Year
•Reported Date
•Category
•Request Status
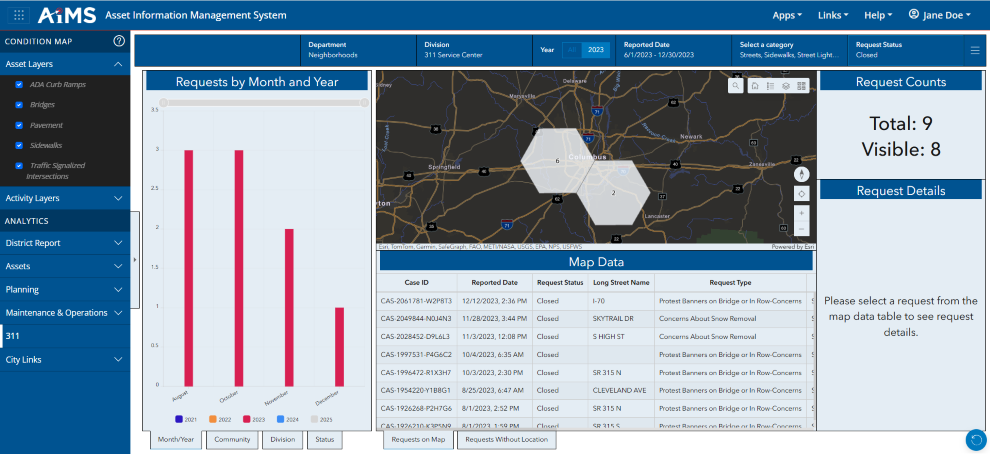
2.In the following example, the Dashboard is filtered to:
•Department: Neighborhoods
•Division: 311 Service Center
•Year: 2023
•Date Range: 6/1/2023 - 12/30/2023
•Category: Streets, Sidewalks, Street Lighting, Sign and Signal Issues
•Status: Closed
This is what the Dashboard now looks like:
B. Sidebar Filters
1.You must click the right-arrow next to the far-left pane to display the Filter pane containing the list of attribute filters. These filters narrow down the data displayed on the Dashboard:
.png)
These are the different filters from which you can choose:
•Request Type
•Street Name. NOTE: This filter is restricted to only show streets in the current map extent. If your desired street does not appear in the street name filter, you must first pan the map to that location.
•Route ID (NLFID)
•Route Type Name
•County Name
•Council District Name
•Functional Class
•High Injury Network
•Community of Interest
•Number of Sidewalks
•Maintenance Zone
•Community Name
•Jurisdiction Name
•Owner Name
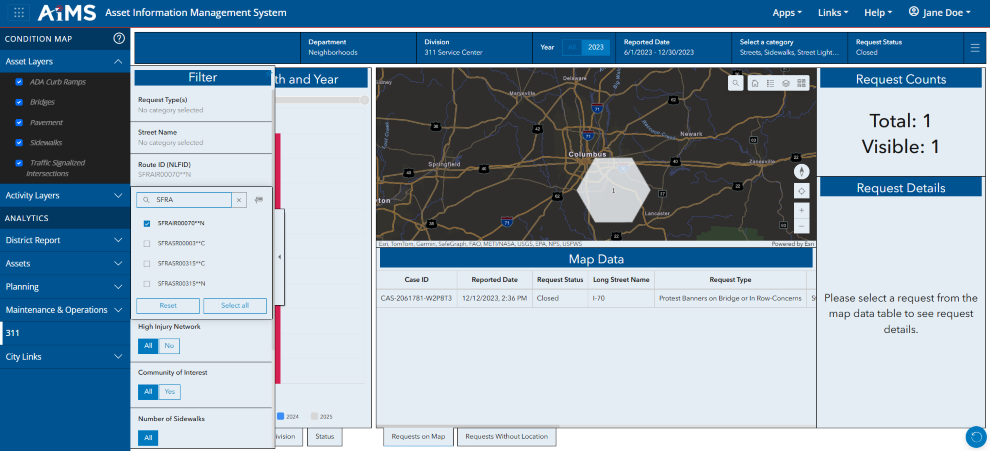
2.In the following illustration, the Dashboard is filtered to a particular Route ID (NLFID).
•Click the Route ID (NLFID) filter in the sidebar.
•Start typing your Route ID in the Search field (in this example: SFRA). A drop-down list appears. NOTE: If you cannot see the Search field, maximize your screen.
•Next, put a check mark next to one or more specific Route IDs (in this example: SFRAIR00070**N) and click Route ID (NLFID) again to close the drop-down list.
•The Dashboard now includes only the 311 requests along that specified route.
|

