The Make a Map module allows you to create new maps for analysis using available data from a set of layers provided by the City of Columbus, or by adding your own data.
1.Click Make a Map from the home page to display the Map Viewer application.
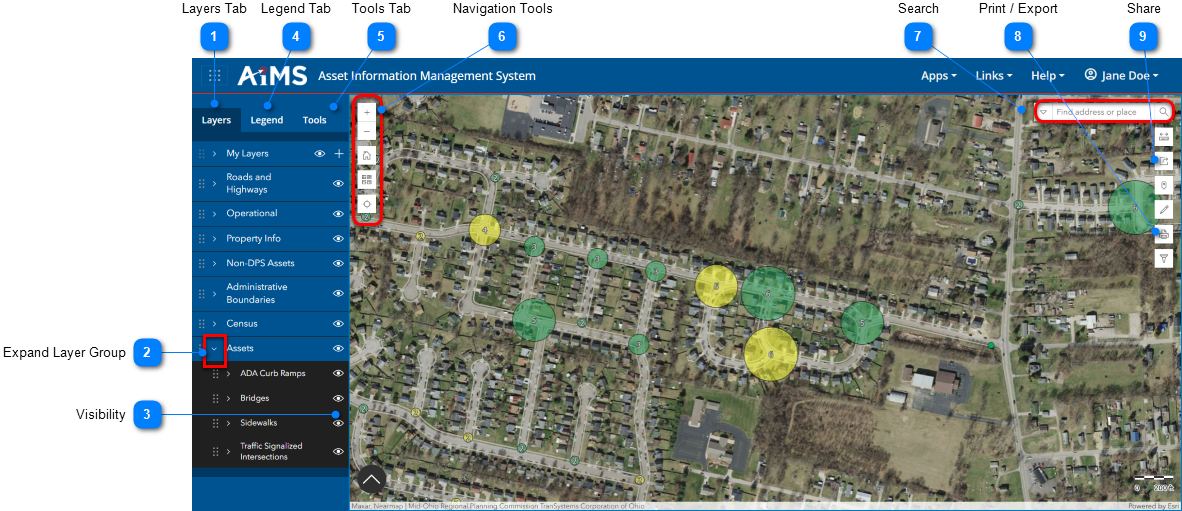
2.The Map Viewer application is an interactive tool for visualizing and exploring data. Results can be printed or shared with other named users within your organization. The tool looks like this. The table beneath the illustration explains the numbered callouts.
Layers Tab
This tab shows the various groups of layers. For details, see: Layers Tab
Expand Layer Group
Click the arrow next to any group to see the GIS layers within it that are available to add to the map. In this example, Assets is expanded to show the list of its layers.
Visibility
Make a layer viewable by selecting the visibility icon
- Layer or group is visible
- Layer or group is not visible
NOTE: Not all users will have access to the same groups and layers. Contact your AIMS administrator if any groups or layers are missing.
The Map Legend is a visual explanation of the symbols displayed in the map. The legend is broken down by layers and includes a brief description of the value that is displayed in the map.
The Export Map tool generates a printable map document. Maps can be exported in a number of file formats, including PDF, PNG, JPG, GIF, TIFF, and more.
The Share Map Tool creates a URL of the current configuration of the data. This includes any filters that were applied, in the current map extent, in the Map Viewer.


.png)


.png)
.png)


