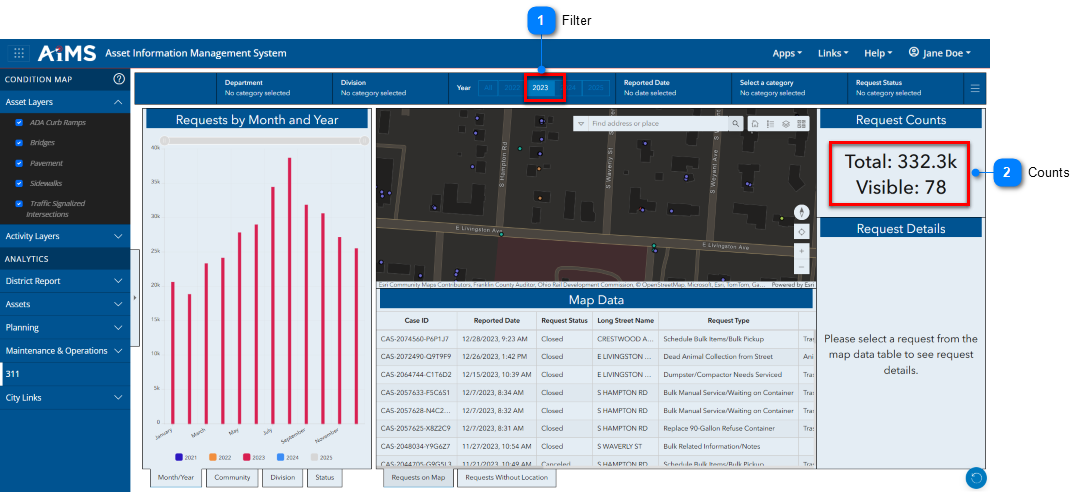
The Requests Counts section of the Dashboard displays the total number of requests and the total number of visible requests, These numbers are both affected by any filters used within the Dashboard. Additionally, the visible count is filtered by the map's extent, and will display only the number of requests visible in the map.
The table beneath the illustration explains the numbered callouts.
Filter
Select the year by which you want to filter the requests (2023 in the illustration).
Counts
The Request Counts tell us tthere were 332.3 k total requests in 2023, and 78 of them are visible in the current map view.