|
The Sketch features allows you to "sketch" on top of a layer to create annotations for the map. These annotations can be shapes and text. Think of them as notes sketched on a map.
1.From the map toolbar, click the Sketch icon.
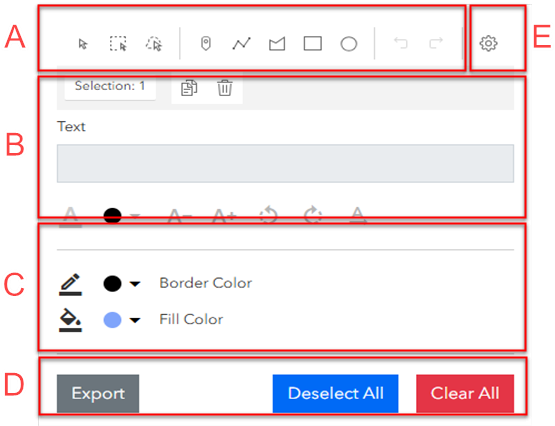
2.The Sketch dialog opens. This allows you to add shapes and text on top of the map layers. The table beneath the illustrations explains sections A-E.
A. Select Items on the Map
.png)
1.Select feature - Click any annotation on the map (text or shape) to select it. This is useful to edit, move, duplicate, or delete the annotation.
2.Select by rectangle - Click and drag diagonally to create a rectangle around one or more annotations you want to select. This is useful to edit, move, duplicate, or delete the annotation(s).
3.Select by lasso - Click and drag to surround a number of annotations you want to select. This is useful to edit, move, duplicate, or delete the annotations.
4.Duplicate features - When one or more annotations are selected, click this icon to duplicate the annotations:
The duplicates appear right on top of the original annotations, so you will want to drag them elsewhere.
5.Delete features - When one or more annotations are selected, click this icon to delete them:
A confirmation dialog opens - select Yes if you want to delete the annotations; otherwise, click No if you changed your mind.
B. Draw Shapes on the Map
(1).png)
IMPORTANT! If you plan to place text in a shape, you must do so in this order: 1) click the shape icon, 2) type the text in the Text field, 3) draw the shape, and 4) enter the text characteristics (color, size, and rotation), and the shape characteristics (border and fill colors).
1.Draw a Point - Click to draw a point.
2.Draw a polyline - Click points to draw a polyline (line with multiple points)
3.Draw a polygon - Click points to draw a polygon
4.Draw a rectangle - Click and drag diagonally to draw a rectangle
5.Draw a circle - Click and drag in any direction to draw a circle.
6.Delete a shape - If you make a mistake, click the shape and press the Delete key (this is not shown in the illustration above)..
C. Add Text Annotations
IMPORTANT! Text can only be placed inside a shape BEFORE the shape is drawn. This means you must do things in this order: 1) click the shape icon, 2) type the text, 3) draw the shape, and 4) enter the text characteristics (color, size, and rotation), and the shape characteristics (border and fill colors).
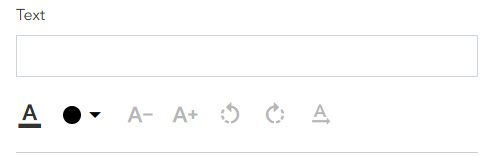
Text - Type the text you want to appear on the map. IMPORTANT: You cannot add text to a shape that is already drawn. The text must be entered AFTER you click the shape icon, but BEFORE you draw the shape.
Once you type the text, you can change any of the following characteristics and then draw the shape:
•Text Color
•Decrease Text Size
•Increase Text Size
•Rotate Text to the Left
•Rotate Text to the Right
•Reset the Text Rotation
D. Set Colors for the Shapes
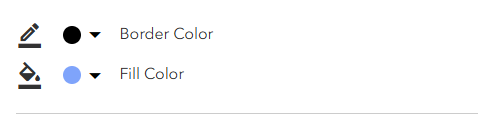
•Set the Border Color. If you set the color first, all shapes you define will have this border color. At any time you can change the border color of the shape by selecting the shape and then choosing a different color. You can also click Deselect All to select all the shapes and change their border color. If you do this, make sure to select Clear All when you are done.
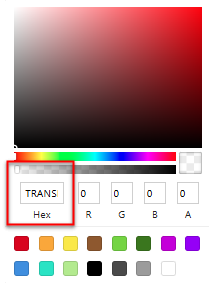
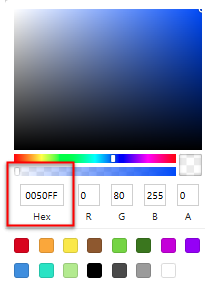
NOTE: If you do not want a border, click the down-arrow next to Border Color and select Transparent (drag the slider bar on the bottom color bar all the way to the left):
•Set the Fill Color. If you set the color first, all shapes you define will have this fill color. At any time you can change the color of the fill by selecting the shape and then choosing a different color. You can also click Select All to select all the shapes. If you do this, make sure to select Deselect All when you are done.
NOTE: If you do not want any fill, click the down-arrow next to Fill Color and then select Transparent (drag the slider bar on the bottom color bar all the way to the left):
E. Choose the Settings
1.Click the Settings icon to display the additional settings information. By default, Enable tooltips is turned on so you can hover over icons in the dialog and see the tooltips.
.png)
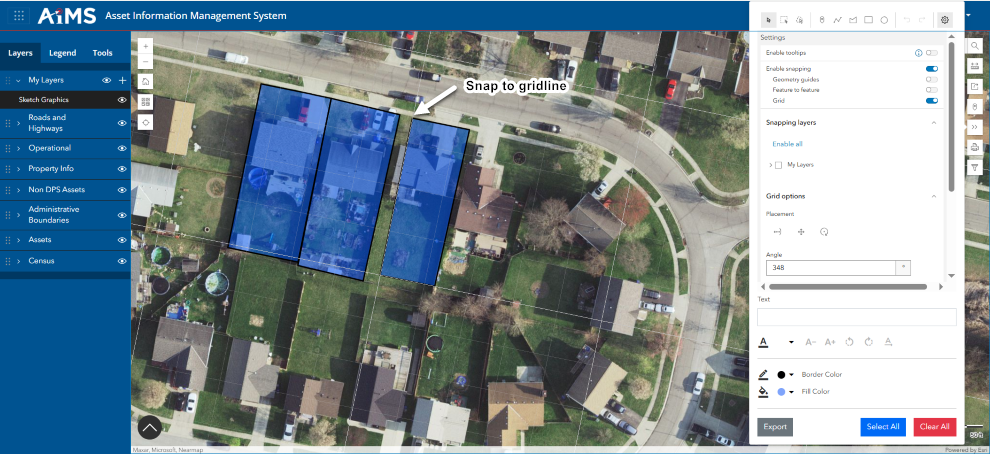
2.Select Enable snapping if you want the shapes you draw to snap to certain items on the map. Then select the items to which you want shapes you draw to snap: Geometry guides, Feature to feature, or Grid.
.png)
You can snap to any of the following items:
a.Geometry guides. Turn on this option to view guidelines on top of the map to help you draw your shape. In this illustration, you see parallel and perpendicular guidelines.
.png)
b.Feature to Feature. Turn on this option so that as you draw your shapes, they snap to a vertex or side of another shape (feature). In this illustration, you see the right polygon snaps to the right side of the left-hand polygon.
.png)
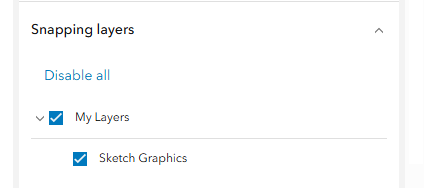
IMPORTANT: For the feature-to-feature option to work, you must go to Snapping layers, select Enable all, and choose My Layers > Sketch Graphics.
c.Grid. Turn on this option to overlay a grid on top of the map and then snap to it as you draw your shapes. In this illustration you see a light colored grid that has been rotated. The left side of the right-hand shape snaps to the grid line.
Go to Grid Options to set the grid options for the appearance of the grid:
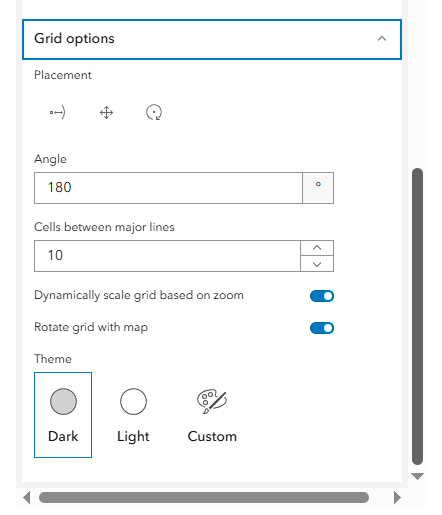
•Placement: Allows you to place the grid as follows.
•Place. Click the icon and the cursor changes to an orange cross. Move the cursor on the map to move the grid. Click again to stop moving the grid, then rotate it as needed, and click again to stop the rotation.
•Move. Click the icon and the cursor changes to an orange cross. Move the cursor up, down, or sideways to move the grid. Click again to stop moving the grid
•Rotate. Click the icon and the cursor changes to an orange cross. Move the cursor around to rotate the grid. Click again to stop rotating the grid.
•Angle. You can also enter a numeric value to fine-tune the rotation. For example, 90, 180, 270, 360 all yield a grid where the grid lines are vertical and horizontal to the map. Other measurements, such as 45, will create a grid where the lines are at other angles to the map.
•Cells between major lines. Determines how many cells (square) appear beneath the major lines of the grid. The major lines are typically darker than the lines delimiting the cells.
•Dynamically scale grid based on zoom. Once the grid appears on the map, it will dynamically size as you zoom in and zoom out.
•Rotate grid with map. Allows the grid to rotate as the map rotates.
•Theme. Defines the color of the grid lines - Dark (dark gray), Light (light gray), or Custom (you choose the color)
E. Clear or Export Annotations
At the bottom of the Sketch dialog, you find these buttons:

•Select All: Click the button to select all the annotations on the map. You can then edit them using the dialog or delete them by pressing the Delete key.
•Deselect All: Click this button to deselect (unselect) all the annotations on the map. NOTE: This button only becomes visible AFTER you make multiple selections.
•Clear All: Click this button to remove all the annotations from the map.
•Export: Click to export the Sketch Layer with its text and shapes, as a shape file. Export the Sketch Layer to your Downloads folder as a zipped file with this name: points_[date][id].
For example: points_20250714181544
This zip file contains all associated feature sets with these names: feature_set.[extension], where [extension] = cpg, dbf, prj, sbn, sbx, shp, shp.xml, shx).
NOTE: These files are used by various other applications that may only support specific file types. For example, you can use them in another application like Earth or AutoCAD. You can also upload them back into the AIMS application using the Add Layer feature. For details, see: Add Local Data layers to the Map Viewer.
|

