|
|
The Work Orders Report allows you to identify patterns and recurring problems in work order requests and completion. This report contains two views:
•The Operations view (default) focuses on the number of work orders.
•The Administrative view focuses on the cost.
BEFORE YOU BEGIN: Make sure you expanded the Maintenance & Operations group and then selected the Work Orders Report.
A. Operations View
This table beneath the illustration explains the numbered callouts in the Operations View of the Work Orders Report.
.png)
|

|
Data Grouping
|
|
Group the data by Columbus Community, Council District, or Work Order Year.
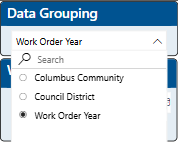
•Click the down-arrow to select a Data Grouping from the drop-down list. NOTE: If you get an error when clicking the down-arrow, try refreshing the screen.
•The selected Data Grouping affects the grouping of the top-left chart (Work Orders chart in the Operations view and Work Order Cost chart in the Administrative view).
•IMPORTANT! This drop-down list does NOT change between the Operations and Administrative views.
|
|

|
Attribute Filters
|
|
Select attribute values from the various drop-down lists to filter the report to only include records with those attributes.
•NOTE: These drop-down lists do NOT change between the Operations and Administrative views.
|
|

|
Switch to Administrative View
|
|
Click the Switch to Administrative View button to switch to the Administrative View.
|
|

|
Work Orders Chart
|
|
This chart displays the count of work orders by the Data Grouping field (selected in the data grouping drop-down) and Division. To filter the report using this chart, click any of the bars in the chart or any of the divisions at the top of the chart.
|
|

|
Count and Cost Indicators
|
|
The count and costs change as filters are applied to the report to display dynamic work order information.
NOTE: The count and cost indicators do NOT change between the Operations and Administrative views.
|
|

|
View Selected Assets on Map
|
|
•Select one or more records (assets) from the Work Order Details table. NOTE: To select multiple records, hold down the Ctrl key while you left-click various records.
•Click the View Selected Assets on Map icon. Another tab opens showing a map with a pop-up dialog on top, indicating the number of features that will be displayed, based on the report specifications. NOTE: An error message appears if no visual data is available; you will not see a map.
•Close the dialog box to see the map. You may have to zoom in to see the selected assets.
•NOTE: The map is limited to showing up to 10,000 of the selected records.
•IMPORTANT! The function of this icon does NOT change between the Operations and Administrative views.
|
|

|
Work Orders by Work Category Table
|
|
This table displays the number of work orders, total cost, and task count for each work category.
•To expand each category listed in the table, click the small icon to the left of any work category in the table (probably looks like a +).
•You can now view information data grouping. For example, in this illustration, Building Equipment if expanded and the data grouping is by Work Order Year.
.png)
•NOTE: Re-click the icon to contract the category.
|
|

|
Work Order Details Table
|
|
This table shows detailed information about each work order in the report.
•To view a single report in more detail, right-click on the row and select Drill through > Explore Work Order Details.
•This opens a new Explore Work Order Details page with detailed information about the attributes of the chosen asset.
•The following illustration shows what happens when you right-click a row of the Work Order Details table with the Work Order # value of 23-112276.
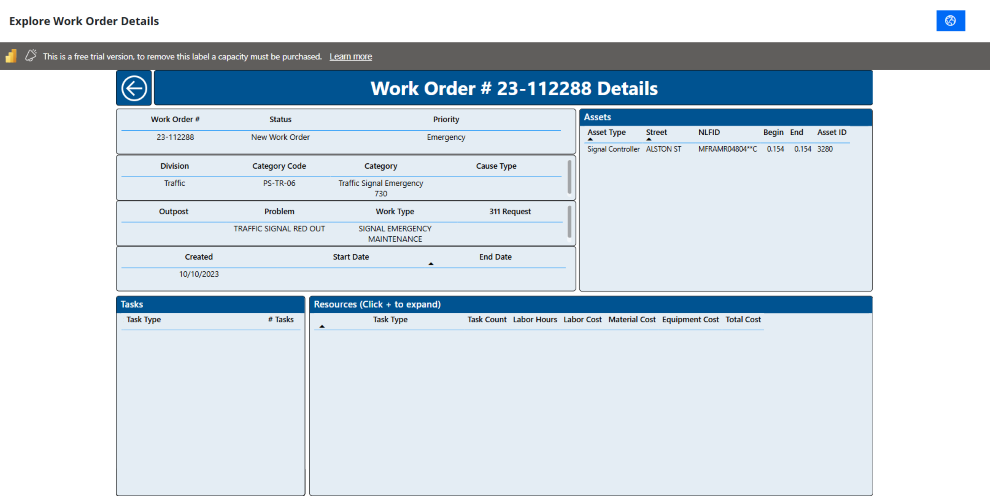
•There is also a blue icon in the upper-right corner that allows you to view the asset on a map.
•Click the large back-arrow icon in the upper-left corner of the Explore Work Order Details page to return to the full report.
NOTE: This page does not change between the Operations and Administrative views.
|
B. Administrative View
This table beneath the illustration explains the numbered callouts in the Administrative View. All other areas of the Administrative View are identical to those in the Operations View that were described earlier. For details, see Operations View.
.png)
|
|
Switch to Operations View
|
|
Click the Switch to Operations View button to switch to the Operations View.
|
|
|
Work Order Cost Chart
|
|
This chart displays the cost of work orders by the Data Grouping field (selected in the data grouping widget) and Resource Type. To filter the report using this chart, click any bar in the chart or any resource type at the top of the chart
|
|
|
Work Order Cost Table
|
|
This table displays the labor, material, equipment, and total costs for each work category. To filter the report using this table, select any row column, or cell in the table.
|
|
|

