The Projects Report helps monitor ongoing projects to ensure projects remain on schedule and within budget.
BEFORE YOU BEGIN: Make sure you expanded the Planning group and then selected the Projects Report.
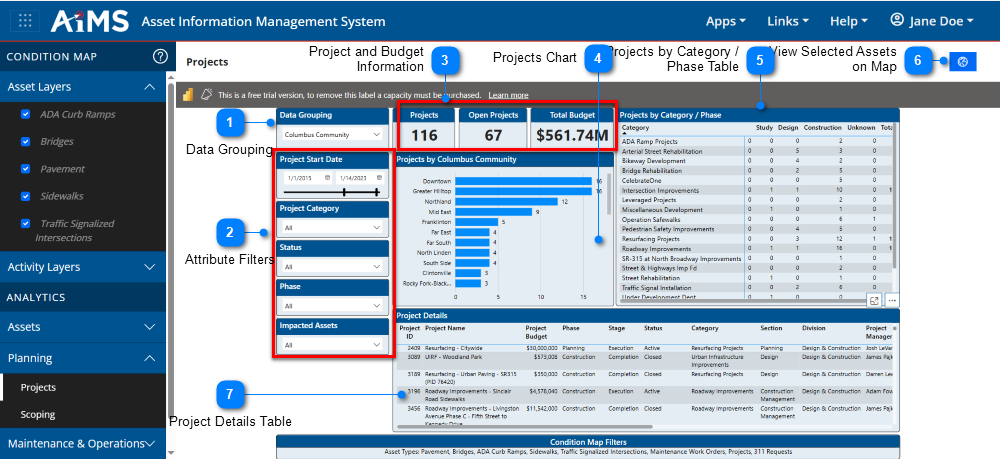
This table beneath the illustration explains the numbered callouts in the Projects Report.
Data Grouping
The data can be grouped by Columbus Community or Council District. This grouping affects the field used for the Projects chart.
Attribute Filters
Set attribute filters by moving the start date slider or selecting attributes from the drop-downs to filter the report accordingly.
Project and Budget Information
The number of projects, active projects, and total budget are displayed here. When filters are applied to the report, these numbers change to represent the filtered features.
Projects Chart
This chart shows the number of projects grouped by the field chosen by the data grouping drop-down list. This chart is filtered by the filters on the left side and by the Projects by Category / Phase table. To filter with this chart, click any bar in the chart.
Projects by Category / Phase Table
This table groups projects by category and displays the number of projects within each phase. To filter the report using this table, click any row, column, or cell in the table.
View Selected Assets on Map
•Select one or more records (assets) from the Project Details table. NOTE: To select multiple records, hold down the Ctrl key while you left-click various records.
•Click the View Selected Assets on Map icon.
•Another tab opens showing a map with a pop-up dialog on top, indicating the number of features that will be displayed, based on the report specifications. NOTE: An error message appears if no visual data is available; you will not see a map.
•Close the dialog box to see the map. You may have to zoom in to see the selected features. NOTE: The map is limited to showing up to 10,000 of the selected records.
Project Details Table
All the individual projects that satisfy the applied attribute filters are displayed in this table.
•To view projects from the Project Details table in more detail, right-click the desired row and select Drill through > Explore Project Details.
•To view one or more selected projects on a map, select the projects from the Project Details table and then click the blue icon in the upper-right corner.
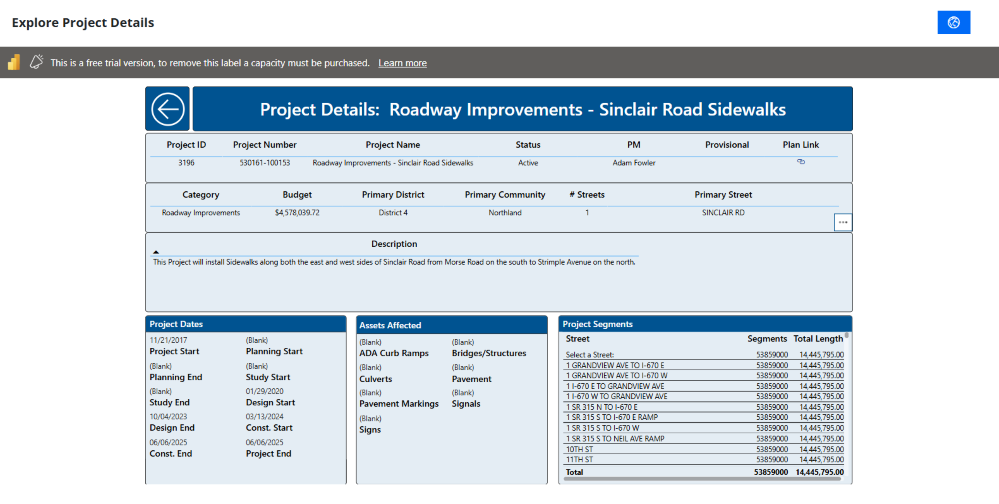
•This opens a new Explore Project Details page with detailed information about the attributes of the chosen asset.
•The following illustration shows what happens when you right-click a row of the Project Details table with the Project ID value of 3196 for Roadway Improvements - Sinclair Road Sidewalks. NOTE: Click the large back-arrow icon in the upper-left corner of the Explore Project Details page to return to the full report.